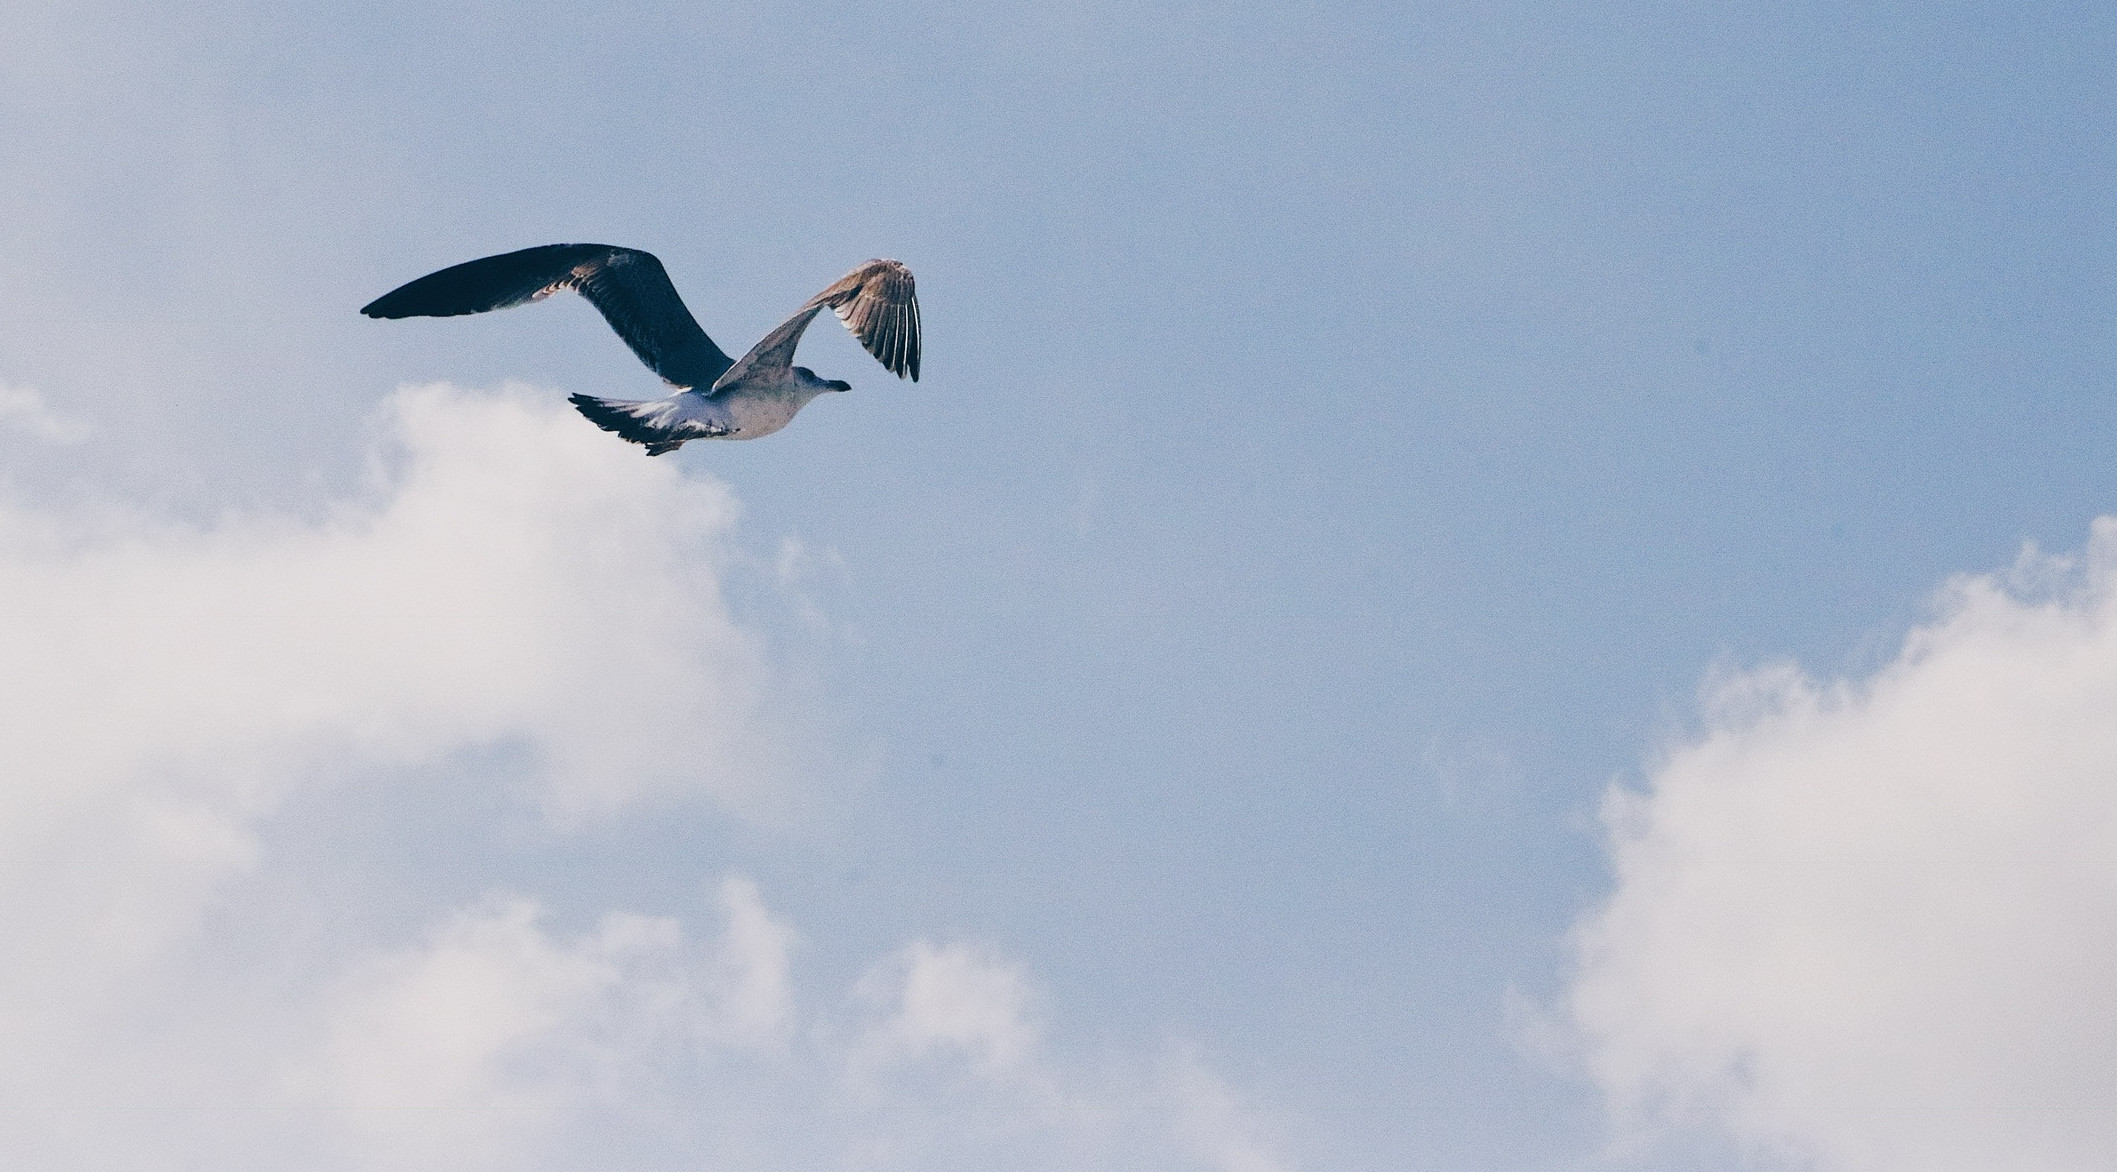
Visualizing the movements of Procellariiformes and Sea Surface Temperature using moveVis
In the framework of the AniMove summer school 2017, the moveVis R package was introduced to the participants, resulting in several likewise interesting and beautiful animal movement animations. The shown animation displays the movement of Procellariiformes near Marion Island, South Africa, against the multi-temporal, daily NOAA sea surface temperature product G1SST. It was created by Tegan Carpenter-Kling, who is a PhD candidate within the Marine Apex Predator Research Unit (MAPRU) based at Nelson Mandela University in Port Elizabeth, South Africa. A large section of her research will focus on quantifying how land based marine predators, such as seabirds and seals, utilize the ocean environment and its resources, with special attention to mechanisms of foraging segregation during the breeding season. For animating her movement and environmental data, Tegan used the animate_move function within the moveVis R package, which is capable of visualizing the tracks of multiple individuals in front of either a static base map or a dynamically changing set of user-defined layers, e. g. representing an environmental variable. In addition, the function offers several path modes, which define the treatment of time information, options for adding static elements such as annotated points, lines or polygons to the animation and more. moveVis is a tool for displaying animal (and other) movement data together with environmental data to visualize interactions between individuals and possible influences of environmental variables on movement behaviour. moveVis is on CRAN and can be installed simply: For more information on moveVis, further example animations and a guide for getting started, visit movevis.org. To learn more about Procellariiformes, get in touch with Tegan Carpenter-Kling on twitter. A similar version of this blog post has also been published at AniMove.org.
## install moveVis from CRAN
install.packages("moveVis")